27 September 2026
This week we turned our attention in class towards a specific type of data: spatial data. I was already incredibly familiar with spatial data and its myriad of uses in the humanities because I have a minor in geographic information systems (GIS) from undergrad. I also currently work as a library data consultant for the Digital Research Services department at UNC Library, so I am more than familiar with spatial data platforms like ArcGIS Pro, QGIS (my beloved!), and ArcGIS Online. With this said, I love working with spatial data and I think it’s an excellent tool to be applied in the humanities.
One of the articles we read this was Beatrice Joyeaux-Prunel’s Digital Humanities for a Spatial, Global, and Social History of Art (2020)1. Joyeaux-Prunel is professor and the chair of Digital Humanities at the University of Geneva. She has worked on and managed numerous digital projects, including the Artlas Project, Postdigital, and VISUAL CONTAGIONS. Her 2020 article focuses on the development of cartographic digital humanities projects as she argues for the use of spatial data in art history.
My favorite part of Joyeaux-Prunel’s article–and the part I find to be most compelling–is her claim that “mapping is a research process rather than an outcome”2. I find that too many digital tools in the digital humanities focus more on presenting the outcome of a research process than actually embedding themselves in that research process. While I am a strong believer in increased accessibility for academic research–and digital tools contribute to that increased accessibility greatly–Joyeaux Prunel argues that spatial data should be incorporated as a part of the art historical research process, not only as a product of it.
Take Google Maps and StoryMaps JS as an example of part versus product. As a part of this week’s class, we were introduced to the two spatial mapping platforms commonly used in humanities projects. I found that both of these platforms were fairly easy to use and designed for beginners working with spatial data. All you need to start a map in Google My Maps and StoryMaps JS is a known location–either one that is already marked on Google Maps (StoryMaps JS is based on the same satellite information used by Google Maps) or the coordinates of a particular point.
I elected to use coordinates for my two test maps since I was working with locations that no longer exist for the most part. My two test maps (both embedded below) include the same four locations around the city of Naples, Italy that pertain to my current master’s thesis project. I am working on paintings of Mount Vesuvius in eruption from the late eighteenth-century by French painter Pierre-Jacques Volaire. Volaire’s work can be roughly categorized into three-to-four groups based on the eruption they are based on and the location they depict Vesuvius from. These four locations are as follows: the Ponte della Maddalena (since destroyed), the Atrio del Cavallo, the Castel dell’Ovo, and the Strada della Marinella in the Piazza al Ponte della Maddalena (since destroyed).
Two of these four locations no longer exist in the modern era and were located via a map of Naples published by Niccolò Carletti (1723-1796) in Mappa Topografica della Città di Napoli e de’ suoi Contorni (1776). The map is uploaded to the Davis Rumsey Map Collection and georeferenced via crowdsourcing3, so it was easy to match the original location of the Ponte della Maddalena to the now aptly-named Via Ponte della Maddalena. From there I collected the coordinates of the now-destroyed bridge and adjoining piazza from Google Maps (not to be confused with the Google My Maps I was creating at this time).
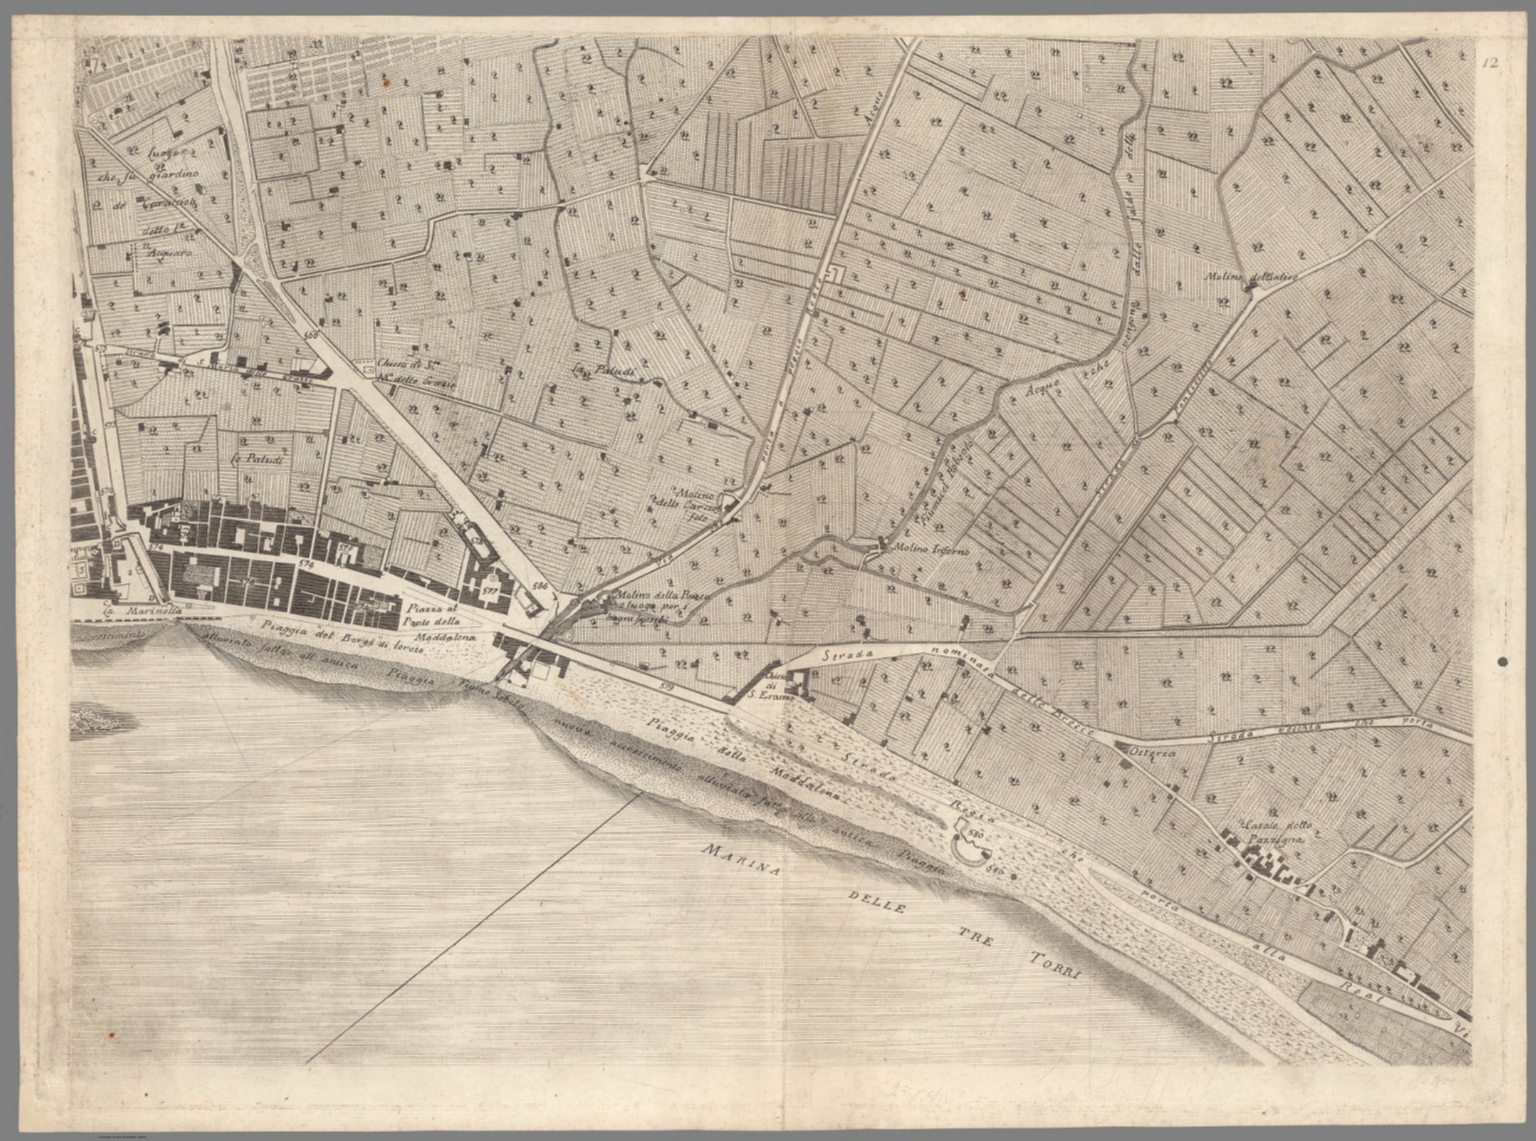
The Ponte della Maddalena is number 579, located above (north of) the Piaggia della Maddalena. The Piazza al Ponte della Maddalena is to the northwest (left) of the bridge.
Link to Google My Maps: here-> (embedded below)
Link to StoryMap: here-> (embedded below)
Having now used both spatial mapping platforms to perform the same function, I find that I prefer Google My Maps to StoryMapsJS. I think StoryMapsJS are a great way to tell a story using spatial data, especially to a more public audience that may not be familiar with humanities fields or spatial data. That said, I am more interested in using spatial data for analysis purposes, which StoryMapsJS just isn’t designed for. For my thesis project, I am working to recreate the different vantage points of Vesuvius in eruption, so I need a data platform that allows for more data manipulation than visualization.
While an excellent tool in communication, StoryMapsJS is not designed to be integrated into the research process. Its design lacks the capacity for deeper analysis beyond visualization. StoryMapsJS JS is meant to show research spatially, not be an active part of it. Google My Maps on the other hand is positioned slightly better to serve as an active part of the research analysis process. Unlike StoryMapsJS, users in Google My Maps can search for locations using satellite imagery and click on the map to pull up specific coordinates. This is better suited for locations that aren’t marked on traditional Google Maps or those that no longer exist, like the Ponte della Maddalena. StoryMapsJS allows users to place points using coordinates, but those coordinates have to be sourced from another location outside of the platform.
All this said, Google My Maps still pales in comparison to actual spatial data software programs like ArcGIS Pro and QGIS for spatial analysis. A user can place points in Google My Maps to visually see spatial information, but there is little other analysis that can be done beyond that. One needs to make the jump to another platform for more in-depth analysis, which requires significant training and oftentimes expensive licenses4. ArcGIS Online is a common middle-ground for users looking for more analytical power than Google My Maps, but don’t need something as powerful as ArcGIS Pro or QGIS.
- Beatrice Joyeux-Prunel, “Digital Humanities for a Spatial, Global, and Social History of Art,” The Routledge Companion, pp. 88-108. ↩︎
- Joyeaux-Prunel (2020): 94. ↩︎
- Pignatelli, Giovanni. Mappa Topografica della Città di Napoli e de’ suoi Contorni. Napoli, 1775. 1:4000. https://davidrumsey.oldmapsonline.org/maps/6498aba9-17b7-53a8-98bb-adc26a2fa9ef/view. ↩︎
- ArcGIS Pro and ArcGIS Online are both owned by ESRI and required a license. UNC users get free access to ESRI products through their university accounts. A personal license is currently $100/year USD. QGIS is open-source and free to download for any user. ↩︎


Leave a Reply